| Home | About OpenOffice.org | Tutorials | FAQs | Sitemap | Help |

| << Inserting Graphics | Creating Charts | Copy Chart to Writer >> |
To insert a chart based on your data, choose "Chart" from the Insert option on the MenuBar.

AutoFormat Chart
The "AutoFormat Chart" window will appear. Notice that calc has automatically selected your data set. If this is not the data you wish to chart, select the data you wish to chart by highlighting the cells containing this data. Here you will also want to select where you want the created chart to appear by using the combo box on the right-hand side of the window. Also note that if you don't want your x and y axis labels automatically created, uncheck the checkboxes on the left-hand side of the window. Once finished, click the "Next" button.

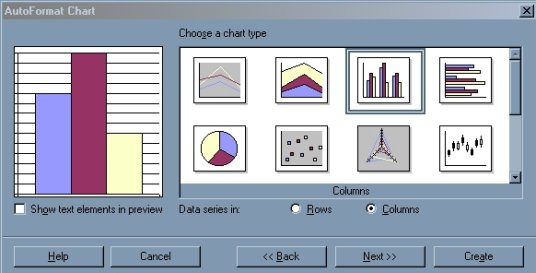
Choose Chart Type
In the next window, you will have the option to choose which type of chart you want to create. After selecting the type, click the "Next" button.

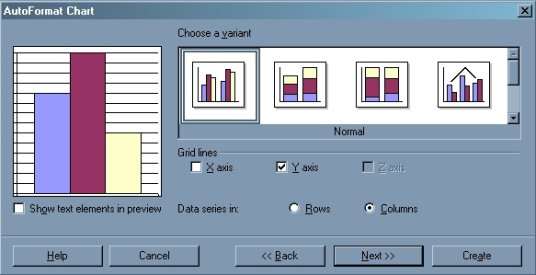
Choose Variant
In the next window, choose the variant you want to use and then click the "Next" button.

Choosing the Labels
In this window, you will be able to add or change the titles of the chart and the x and y axis. When done, click the "Create" button and your chart will be automatically created.

Finished Chart

| << Inserting Graphics | Creating Charts | Copy Chart to Writer >> |
Home | About OpenOffice.org | Tutorials | FAQs | Sitemap | Help