![]()
Single Impurity Molecule Spectroscopy
I. Introduction
The electronic spectra of organic impurity molecules in solids usually contain broad (hundreds and thousands of wavenumbers) bands even at liquid helium temperatures. These inhomogeneously broadened spectra are of low value for analysis, science and applications. In the beginning of 1970-s two techniques of selective laser spectroscopy, fluorescence line narrowing [ 1] and persistent spectral hole burning [2], were developed. Due to the zero-phonon lines (an optical analog of the resonance gamma-line in the Mössbauer effect) [3], and by means of eliminating the inhomogeneous broadening, these techniques of "site selective spectroscopy" provide us with fine-structured spectra of impurity centers in low-temperature solids and are used for very fine and precise spectroscopic measurements. In our earlier research we mostly used the technique of spectral hole burning to study dynamical processes in doped low-temperature amorphous solids [1-9,14,15,21].
As it appeared soon, the site selective spectroscopy cannot actually remove all the inhomogeneity. In fact, impurity molecules having the same optical transition energy may differ from each other in their host-guest interactions, their exited state lifetime, their homogeneous linewidth, etc. Therefore, even the site selective spectroscopy of very high resolution provides merely an average information about ensembles of molecules. An important advance in this matter was the discovery in 1989 of a new branch of high-resolution spectroscopy of solid state, single-molecule spectroscopy (SMS) [4], which showed significant improvements in signal-to-noise ratio and sensitivity in its fluorescence-excitation version [5]. The SMS technique enabled a novel spectroscopy of individual impurity molecules in solids, where all kinds of inhomogeneity and averaging are suppressed. It also opened the way for new experiments having no equivalents with ensembles, e.g. the study of spectral diffusion and hole-burning processes by observation of spectral jumps of individual molecules (see [6] for review).
REFERENCES :
II. Our SMS Research
At Institute of Physics (IP), single molecule spectroscopy (SMS) research was initiated and supervised by Prof. Karl K.Rebane. The preparation for SMS experiments started already in 1991.
An SMS optical cell was built in 1992 as a sample holder for a small-volume immersion helium cryostat; this cell was designed for a solid thin-film sample to be attached to the surface of a thin metal disc with a 5 μm pinhole. By positioning condenser lenses into the cryostat, the light-collecting optics' numerical aperture (NA) of 0.6 was achieved [10]. In 1993 the cell was successfully applied for SMS measurements of pentacene-doped p-terphenyl in co-operation with Prof. U.P.Wild's SMS group (ETH Zürich); subsequently, in analogous experiments realized at IP single-molecule spectra with signal-to-the-background ratio of up to 10:1 have been obtained. Single-molecule linewidths were measured in fluorescence excitation spectra of pentacene O1 and O2 sites at 1.85 K; single-molecule lines narrower than the average natural linewidth have been reported for the first time [10]. The IP SMS group was globally the fourth experimental group to obtain reliable single impurity molecule spectra; authors of this work [10] received the Estonian State Science Award (1996, Natural Sciences).
In co-operation with colleagues from ETH Zurich and IBM an experimental setup with a parabolic mirror was used to study spectral jumps of individual impurity molecule lines in fluorescence excitation spectra of terrylene-doped Shpol'skii matrix hexadecane. Two- and multistate impurity centers were observed [11]. The same experimental setup was used to perform saturation analyses for single molecules embedded in the Shpol’skii matrix. Several physical effects were included into the analysis to determine the orientation of the molecular dipole of single terrylene molecules in hexadecane and to reconcile the differences between measurements on this system and on the same molecule in polyethylene [12]. A new polymorphic matrix benzophenone, doped with terrylene molecules, was applied for SMS. Single terrylene molecules were detected in the polycrystalline phase of benzophenone, but in the glassy phase at T = 2 K no single molecules could be resolved [13].
A simplified modification [18] of an SMS optical cell with sample located at the joint focus of a parabolic mirror (NA ~ 0.95) and a focusing lens was built at IP and applied to perform SMS experiments with terrylene-doped Shpol’skii systems:
A new method [18] of finding the correct position of the laser beam focus on the sample was successfully applied resulting in the first single-molecule spectra for a new SMS Shpol'skii system terrylene in n-decane; the signal-to-the-background ratio of up to 15:1 was obtained at T = 1.7 K (see Fig.1) [16]. Zero-phonon transition lines of single terrylene molecules were observed in a broad spectral interval between 578 nm and 566 nm. In addition to the main Shpol'skii site at 576 nm, the second Shpol'skii site was found at 568 nm, overlapping in excitation spectra with the vibrational band of the main site (vibration ~245 cm-1 of the terrylene molecule). An explanation, based on possible nonmonotonic energy dependence of the density of electromagnetic states in inhomogeneous optical medium, was proposed for the time-dependent linewidth observed for a single terrylene impurity molecule [16].
As it was shown in co-operation with German colleagues, for several mixtures of n-alkanes doped with terrylene it is possible to obtain single-molecule spectra of similar quality to that obtained for the Shpol’skii system terrylene in n-decane [17].
Gradual slowing down of the rate of spectral jumps of a terrylene single-molecule line in the Shpol’skii matrix of n-decane was observed at 1.7 K after cooling the sample down from the room temperature; such a behaviour demonstrates that low-temperature relaxation of the nonequilibrium energy stored during the cooling of a sample can play an important role in the processes of spectral diffusion [19].
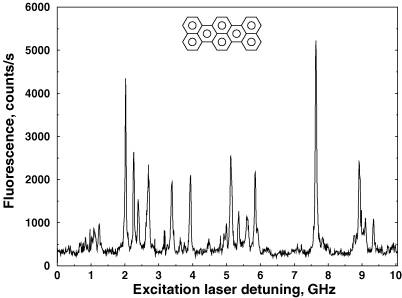
Fig.1. An example of fluorescence excitation spectrum obtained at 1.7 K using a home-made optical cell for SMS [18]. A sample of a frozen dilute (conc. ~10-7 mol/mol) solution of terrylene (molecular structure presented in the insert) in n-decane was about 3 μm thick. Presented is a 0.33 cm-1 long fragment of a 14 cm-1 broad inhomogeneous band of the B site of this Shpol’skii system near to the band maximum at λ ≈ 576.0 nm [16]. Zero laser detuning corresponds to ν ≈ 17361.11 cm-1 ; excitation intensity - 0.1 W/cm2, laser scanning rate - 10 MHz/s, signal collection - 1 s per point. Sharp peaks correspond to zero-phonon lines of the S1 <-- S0 transition of individual terrylene molecules. |
In co-operation with colleagues from ETH Zurich a series of SMS measurements was performed with a thin film of terrylene-doped polyethylene in a dilution 3He-4He refrigerator at ultralow (down to 30 mK) temperatures [20]. A CCD camera was used for imaging of the surface of the sample (single-molecule microscopy); spectral movies consisting of 1000 frames (512x512 resolution images) were taken by scanning the excitation laser frequency in a range of 2 GHz with a 2 MHz step. About 100 - 300 single-molecule lines could be observed in every movie at different coordinates x,y providing good statistical material of linewidths and probabilities of spectral jumps (processes of spectral diffusion). At 30 mK, the linewidth distribution for single terrylene molecules in polyethylene was found to have the full-width at half-maximum (FWHM) of 18.6 MHz and the average linewidth of 42.8 MHz, which indicated possible distribution of natural linewidths of single terrylene molecules.
Interferometric Signatures of Single Molecules [22].
Saturation spectroscopy of vibronic transitions in single molecules [23].
These SMS investigations were performed in tight cooperation with the Prof. U.P.Wild laboratory (ETH Zurich).![]()
![]()