Mathematica Tips and Tricks
Plotting Mass Spectra
15.03.2010
A function to draw mass spectrum plots with different colours for different fields, and mixing.
First lets give some default options: Options[massSpectrumPlot] = {showPhase -> True, showPhaseDisk -> False, lineLength -> 100, lineThickness -> Thick, labelOffset -> 0.1, arrowProportion -> 0.03, arrowheadSize -> Small, arrowColor -> Black, labelStyle -> {FontSize -> 10}, showOptions -> {ImageSize -> Small}, colors -> {{Black}, {ColorData["Legacy"][67], ColorData["Legacy"][144]}, {ColorData["Legacy"][67], ColorData["Legacy"][144], ColorData["Legacy"][59]}, {ColorData["Legacy"][67], ColorData["Legacy"][144], ColorData["Legacy"][24], ColorData["Legacy"][59]}} }; The showPhase option determines whether to show the phases of the coefficients of fields with little arrows; if showPhaseDisk is True, each arrow will be in a little clockface.
No arrow will be shown for zero phase.
If the numerical values of the masses are not in the range of a couple of hundred, it is best to set lineLength and labelOffset to a value proportional to the biggest mass. arrowProportion sets the ratio of arrow length to lineLength. The labelStyle will be passed on to the Styles for text labels and the showOptions will be passed on to Show to set image size, for example. We have predefined line color for up to four fields, with colours somewhat muted from the primary RGB.
- Mass spectrum drawing code with examples as a Mathematica 7 notebook
The points must be given as {{Subscript[m, 1], 10, {1}}, {Subscript[m, 2], 20, {0.3 (1 - I), 0.7}}, {Subscript[m, 3], 25, {1 + I, 1}, {ColorData["Legacy"][45], ColorData["Legacy"][49]}}} – that is, a list of {mass name, mass value, {coefficients of the mixed fields}, {colours}}, where the colours are optional.
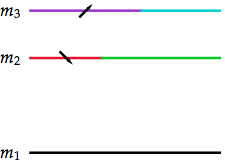 These points, with a couple of options added –
 massSpectrumPlot[{{Subscript[m, 1], 10, {1}}, {Subscript[m, 2], 20, {0.3 (1 - I), 0.7}}, {Subscript[m, 3], 25, {1 + I, 1}, {ColorData["Legacy"][45], ColorData["Legacy"][49]}}}, lineLength -> 20, labelOffset -> 1, arrowProportion -> 0.1, labelStyle -> {FontSize -> 14, FontFamily -> "Palatino"}] – produce the plot on the right.
Colouring Points in List Plots
It is possible to apply a ColorFunction to ListPlot points only if they are Joined.
But there is a simple workaround: package each point in a list and generate PlotStyle for each list. For example, if you have a list of three-dimensional data (with the z-coördinate between 0 and 1 for simplicity), pts = {{x1, y1, z1}, … } you can write ListPlot[ {Take[#,2]}&/@pts, PlotStyle -> Evaluate[GrayLevel[Last[#]]&/@pts] ] to colour the points from black to white.
Taming Table in Mathematica 5
04.01.2005 (revised 13.11.2006)
- Code for table taming in a notebook.
In my program for solving renormalization group equations, I had to implement vector or matrix functions as vectors or matrices of functions, based on the dimensions of their initial conditions.
At length I found that Array does the job. E.g. for a 2×2 matrix whose Dimensions are {2, 2}, Array[f[##][x] &, {2, 2}] returns the following 2×2 matrix of indexed functions: {{f[1, 1][x], f[1, 2][x]}, {f[2, 1][x], f[2, 2][x]}};
It works well for vectors or matrices. But what about numbers? Dimensions returns {} for a number; and Array chokes on it.
In Mathematica 5.2, Array[f[##][t] &, {}] does not give an error anymore, but returns f[][t].
A relatively reasonable behaviour of Array for {} is achieved with Unprotect[Array]; Array[x_, {}] = First[Array[x, 1, 0]]; Protect[Array];
Then Array[f[##][x] &, {}] returns f[0][x]. (I chose to return not an array with one element, but the element.)
But there is a more elegant solution based on Tables with a variable number of iterators.
The Table function of Mathematica does not evaluate its iterators by default. Writing e.g. iter = {i, 1, 3}; Table[f[i], iter] results in an error. (Similarly for Do, Sum, Product, etc.)
Thanks to Bob Hanlon and Arne Eide for pointing that out.
It has to be written as iter = {i, 1, 3}; Table[f[i], iter//Evaluate];
Let us construct iteration variables and iterators for a more general case.
E.g. for a 2×3 matrix, iterators can be constructed from its dimensions as iters = Apply[Sequence, MapIndexed[{i[First[#2]], 1, #1} &, {2, 3}]]; returning Sequence[{i[1], 1, 2}, {i[2], 1, 3}];
The sequence of iteration variables is itervars = Apply[Sequence, Map[i[#] &, Range[Length[{2, 3}]]]] for the 2×3 matrix.
This way the clash with Dimensions for numbers is absent, too: MapIndexed returns {} on {}, Sequence[{}] disappears, and we are left with Table[f[]] that returns just f[].
My suggestions for the makers of Mathematica are:
- Remove the clash between
Array and Dimensions
- Add a function to construct iterators from
Dimensions of an array for use in Table.