Point in Polygon & Intersect
Finding out if a certain point is located inside or outside of an area, or finding out if a line intersects with another line or polygon are fundamental geospatial operations that are often used e.g. to select data based on location. Such spatial queries are one of the typical first steps of the workflow when doing spatial analysis. Performing a spatial join (will be introduced later) between two spatial datasets is one of the most typical applications where Point in Polygon query is used.
How to check if point is inside a polygon?
Computationally, detecting if a point is inside a polygon is a complicated matter. Luckily, we can use ready-made function for conducting the Point in Polygon query. We can take advantage of Shapely’s binary predicates that can evaluate the topolocical relationships between geographical objects, such as the PIP as we’re interested here.
There are basically two ways of conducting Point in Polygon queries in Shapely:
using a function called .within() that checks if a point is within a polygon
using a function called .contains() that checks if a polygon contains a point
Notice: even though we are talking here about Point in Polygon operation, it is also possible to check if a LineString or Polygon is inside another Polygon.
Let’s first create a Polygon using a list of coordinate-tuples and a couple of Point objects
from shapely.geometry import Point, Polygon

# Create Point objects
p1 = Point(24.952242, 60.1696017)
p2 = Point(24.976567, 60.1612500)

# Create a Polygon
coords = [(24.950899, 60.169158), (24.953492, 60.169158), (24.953510, 60.170104), (24.950958, 60.169990)]
poly = Polygon(coords)
# Let's check what we have
In [1]: print(p1)
POINT (24.952242 60.1696017)

In [2]: print(p2)
POINT (24.976567 60.16125)

In [3]: print(poly)
POLYGON ((24.950899 60.169158, 24.953492 60.169158, 24.95351 60.170104, 24.950958 60.16999, 24.950899 60.169158))
Let’s check if those points are
withinthe polygon
# Check if p1 is within the polygon using the within function
In [4]: p1.within(poly)
Out[4]: True

# Check if p2 is within the polygon
In [5]: p2.within(poly)
Out[5]: False
Okey, so we can see that the first point seems to be inside that polygon and the other one doesn’t.
In fact, the first point is close to the center of the polygon as we can see:
# Our point
In [6]: print(p1)
POINT (24.952242 60.1696017)

# The centroid
In [7]: print(poly.centroid)
POINT (24.95224242849236 60.16960179038188)
It is also possible to do PIP other way around, i.e. to check if polygon contains a point:
# Does polygon contain p1?
In [8]: poly.contains(p1)
Out[8]: True

# Does polygon contain p2?
In [9]: poly.contains(p2)
Out[9]: False
Thus, both ways of checking the spatial relationship results in the same way.
Which one should you use then? Well, it depends:
if you have many points and just one polygon and you try to find out which one of them is inside the polygon:
you need to iterate over the points and check one at a time if it is within() the polygon specified
if you have many polygons and just one point and you want to find out which polygon contains the point
you need to iterate over the polygons until you find a polygon that contains() the point specified (assuming there are no overlapping polygons)
Intersect
Another typical geospatial operation is to see if a geometry intersect or touches another one. The difference between these two is that:
if objects intersect, the boundary and interior of an object needs to intersect in any way with those of the other.
If an object touches the other one, it is only necessary to have (at least) a single point of their boundaries in common but their interiors shoud NOT intersect.
Let’s try these out.
Let’s create two LineStrings
from shapely.geometry import LineString, MultiLineString

# Create two lines
line_a = LineString([(0, 0), (1, 1)])
line_b = LineString([(1, 1), (0, 2)])
Let’s see if they intersect
In [10]: line_a.intersects(line_b)
Out[10]: True
Do they also touch each other?
In [11]: line_a.touches(line_b)
Out[11]: True
Indeed, they do and we can see this by plotting the features together
# Create a MultiLineString
In [12]: multi_line = MultiLineString([line_a, line_b])

In [13]: multi_line
Out[13]: <shapely.geometry.multilinestring.MultiLineString at 0x2a4d6283b08>
Thus, the line_b continues from the same node ( (1,1) ) where line_a ends.
However, if the lines overlap fully, they don’t touch due to the spatial relationship rule, as we can see:
Check if line_a touches itself
# Does the line touch with itself?
In [14]: line_a.touches(line_a)
Out[14]: False
It does not. However, it does intersect
# Does the line intersect with itself?
In [15]: line_a.intersects(line_a)
Out[15]: True
Point in Polygon using Geopandas
Next we will do a practical example where we check which of Estonian Category III protected species sightings from a prepared monitoring GeoPackage file, category_3_species_porijogi.gpkg, are located in the Idaoja sub-catchment of the Porijogi river, by cross-checking with the polygons from a GeoJSON-file . The Polygons are the modelled sub-catchments of the Porijogi river.
However, reading a layer from a GeoPackage file needs an additional information of the layer name, because GeoPackage is basically an embedded database format,
building on top of SQLite.
Let’s start by reading the addresses from the GeoPackage layer file.
In [16]: import geopandas as gpd

# protected species under class 3 monitoring sightings
In [17]: species_fp = "source/_static/data/L3/category_3_species_porijogi.gpkg"

In [18]: species_data = gpd.read_file(species_fp, layer='category_3_species_porijogi', driver='GPKG')
Reading GeoJSON-files in Geopandas
It is possible to read the data from GeoJSON-file in the same manner as Shapefile.
# porijogi_sub_catchments
In [19]: polys_fp = "source/_static/data/L3/porijogi_sub_catchments.geojson"

In [20]: polys = gpd.read_file(polys_fp, driver='GeoJSON')

In [21]: polys.head(5)
Out[21]:
   OBJECTID     NAME_1       AREA_1    Shape_Leng    Shape_Area  ID  \
0         8     Idaoja  3823.427995  35446.162219  3.823428e+07   1
1         9  Keskjooks  5087.809731  42814.174755  5.087810e+07   2
2        10      Peeda  5634.162684  47792.268153  5.634163e+07   3
3        11       Sipe   890.280919  16449.028656  8.902809e+06   4
4        12      Tatra  3306.643841  31108.960376  3.306644e+07   5

                                            geometry
0  MULTIPOLYGON (((660834.858 6455555.914, 660851...
1  MULTIPOLYGON (((666339.502 6455972.600, 666384...
2  MULTIPOLYGON (((659914.002 6456514.131, 659817...
3  MULTIPOLYGON (((665928.914 6460634.243, 665985...
4  MULTIPOLYGON (((658678.470 6457825.152, 658579...
Nice, now we can see that we have the sub-diveded catchments for the Porijogi river. We are interested in the sub-catchment that is called Idaoja.
Let’s select that one and see where it is located, and plot also the points on top of the map.
import matplotlib.pyplot as plt
%matplotlib inline
plt.style.use('ggplot')
plt.rcParams['figure.figsize'] = (15, 15)
In [22]: subcatch = polys.loc[polys['NAME_1']=='Idaoja']

In [23]: subcatch.reset_index(drop=True, inplace=True)

In [24]: fig, ax = plt.subplots();

In [25]: polys.plot(ax=ax, facecolor='gray');

In [26]: subcatch.plot(ax=ax, facecolor='red');

In [27]: species_data.plot(ax=ax, color='blue', markersize=5);

In [28]: plt.tight_layout();
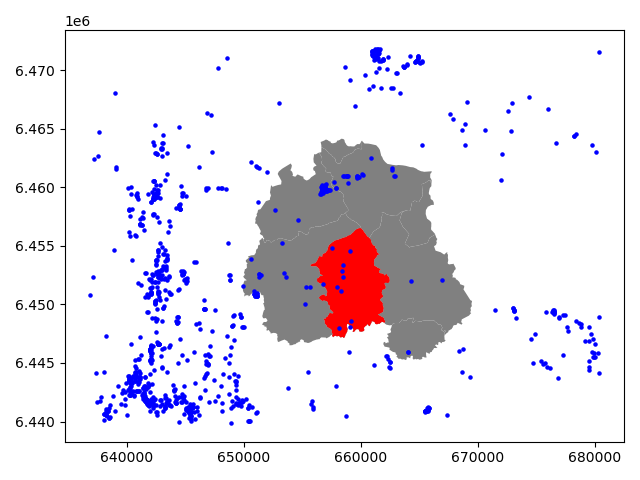
Okey, so we can see that, indeed, certain points are within the selected red Polygon.
Let’s find out which one of them are located within the Polygon. Hence, we are conducting a Point in Polygon query.
Let’s first enable shapely.speedups which makes some of the spatial queries running faster.
In [29]: import shapely.speedups

In [30]: shapely.speedups.enable()
Let’s check which Points are within the
subcatchPolygon. Notice, that here we check if the Points arewithinthe geometry of thesubcatchGeoDataFrame. Hence, we use theloc[0, 'geometry']to parse the actual Polygon geometry object from the GeoDataFrame.
In [31]: pip_mask = species_data.within(subcatch.loc[0, 'geometry'])

In [32]: display(pip_mask)
0       False
1       False
2       False
3       False
4       False
        ...
1032    False
1033    False
1034    False
1035    False
1036    False
Length: 1037, dtype: bool
As we can see, we now have an array of boolean values for each row, where the result is True
if Point was inside the Polygon, and False if it was not.
We can now use this mask array to select the Points that are inside the Polygon. Selecting data with this kind of mask array (of boolean values) is easy by passing the array inside the
locindexing function of Pandas.
In [33]: pip_data = species_data.loc[pip_mask]

In [34]: pip_data
Out[34]:
     OBJECTID        LIIK             NIMI   EXT_SYST_I    KKR_KOOD PRIV_TYYP  \
249    152958  taimed III    ohakasoomukas  -1902179792  KLO9331094    Avalik
674    145079  loomad III  valge-toonekurg  -1632330969  KLO9105497    Avalik
691    145191  loomad III  valge-toonekurg   1355787943  KLO9105625    Avalik
694    145194  loomad III  valge-toonekurg   1430734590  KLO9105624    Avalik
695    145196  loomad III  valge-toonekurg   1653031368  KLO9105598    Avalik
979    147275  loomad III  valge-toonekurg   -934352158  KLO9108256    Avalik
980    147279  loomad III  valge-toonekurg   -345614917  KLO9108257    Avalik
982    147282  loomad III  valge-toonekurg     13169300  KLO9108254    Avalik
985    147297  loomad III  valge-toonekurg   1849924613  KLO9108255    Avalik

          STAATUS  IMPORT  LAADIMISKP                        geometry
249  kontrollitud       0  2018-10-29  POINT (657531.007 6454827.405)
674  kontrollitud       0  2018-10-29  POINT (657952.380 6451525.770)
691  kontrollitud       0  2018-10-29  POINT (659189.190 6448592.205)
694  kontrollitud       0  2018-10-29  POINT (658311.690 6451115.475)
695  kontrollitud       0  2018-10-29  POINT (658117.710 6447988.785)
979  kontrollitud       0  2018-10-29  POINT (659040.735 6454585.439)
980  kontrollitud       0  2018-10-29  POINT (658493.413 6453377.590)
982  kontrollitud       0  2018-10-29  POINT (658495.234 6452311.248)
985  kontrollitud       0  2018-10-29  POINT (658387.491 6452891.505)
Let’s finally confirm that our Point in Polygon query worked as it should by plotting the data.
In [35]: subcatch = polys.loc[polys['NAME_1']=='Idaoja']

In [36]: subcatch.reset_index(drop=True, inplace=True)

In [37]: fig, ax = plt.subplots()

In [38]: polys.plot(ax=ax, facecolor='gray');

In [39]: subcatch.plot(ax=ax, facecolor='red');

In [40]: pip_data.plot(ax=ax, color='gold', markersize=10);

In [41]: plt.tight_layout();
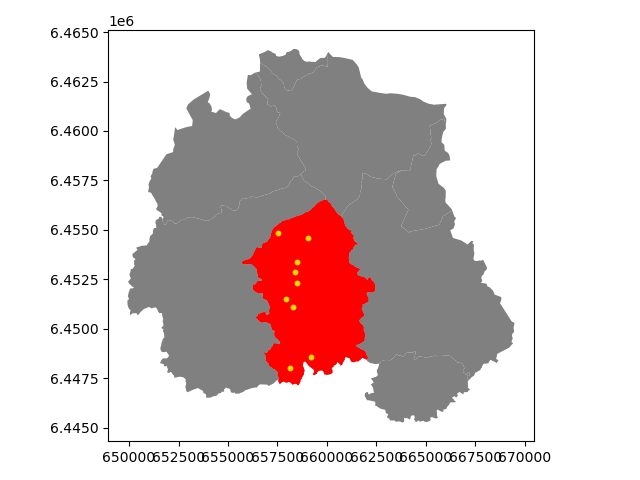
Now we only have the (golden) points that, indeed, are inside the red Polygon which is exactly what we wanted!
Launch in the web/MyBinder: