Examples 2018
Birth rate and average income in Estonia in 2016
Daiga Paršova, static map with geopandas/matplotlib
“Birth rate in Estonia in 2016”
“Gross average monthly income in Estonia in 2016”
Number of crimes (burglary, robbery, vandalism) per district in Boston
by Katharina Fogelberg, dynamic map with Leaflet
Estonian vs Russian speakers outbound travel (from Estonia to international destinations) 2014-2016
by Veronika Mooses, dynamic maps with plotly
“Estonian speakers outbound travel (from Estonia to international destinations) 2014-2016”
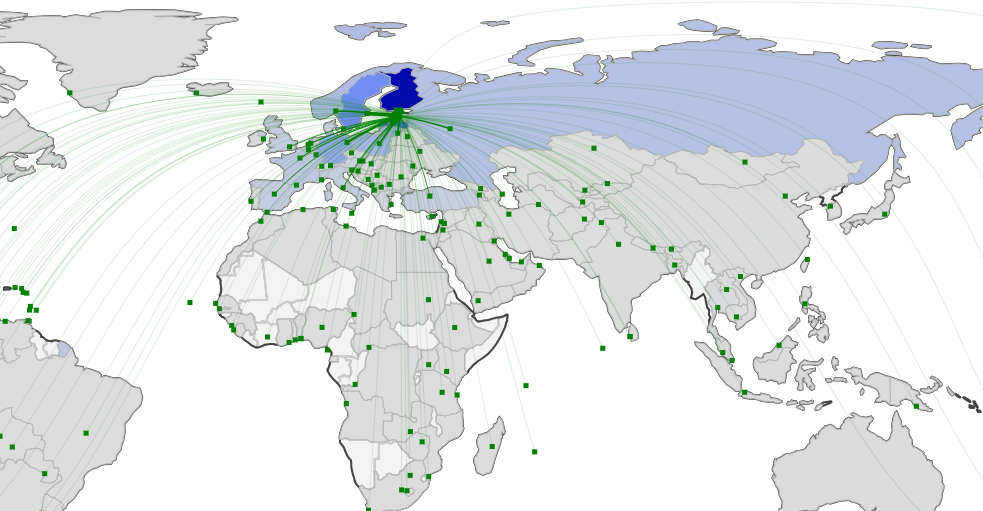
Click here to view interactive version!
“Russian speakers outbound (from Estonia to international destinations) travel 2014-2016”