Python and R mixed work environments
This short lesson is meant as an outlook to some additional ways how to work with and visualize geospatial data with Python and R. In particular:
Use cases of Python and R interoperability
A short introductory video:
Typically, you should focus on your preferred language to solve problems. You are more comfortable and have more practice in expressing your problem-solving ideas in code in your preferred language as compared to “the other” language.
For most tasks that we do in geospatial analysis there are plenty of robust packages available in both languages. There might only be a few edge cases where a functionality is not available in your preferred language. That might be reason to try linking in that package from the other language into your normal workflow.
Other reasons might include you joining a team that focusses on a program language that you are not so comfortable in. Then you have the choice of learning that language or alternatively, link these languages. This also called polyglot programming, and seems to become an increasingly accepted method in data science, data engineering and data analyst teams. The important bit is, that the scripts and software functions are part of an overall processing pipeline and need to work together somehow.
Last but not least, a situation might arise where you have to pick up someone else’s work, e.g. processing and statistics scripts that a part o an important project that run every night or every week, and you can’t immediately convert/port all the code into your preferred language, and at the same time, of course management wants you to fix bugs or add new functions. What you can do is to keep those scripts running and slowly link/integrate them with code from your preferred language. In the mean time the existing code is still productive, but you can already start developing new functions and converting existing functions to your preferred language.
Running R in a Jupyter notebook instead of R Studio
Calling Python from R with Reticulate
Calling R from Python with rpy2
Download sample notebooks and scripts from here. The testdata used is available from the former lectures.
Jupyter:IRkernel
In R or R Studio you can simply install the R kernel package. As we have already Jupyter and everything set up in our geopy2020 environment, no additional Python-based configuration or installation is necessary.
install.packages('IRkernel')

IRkernel::installspec(user = TRUE)
To install system-wide, set user to FALSE in the installspec command.
Then you should simply have another kernel available to choose in your Jupyter lab/notebook environment.
R:Reticulate
The reticulate package provides a comprehensive set of tools for interoperability between Python and R.

The package includes facilities for:
Calling Python from R in a variety of ways including R Markdown, sourcing Python scripts, importing Python modules, and using Python interactively within an R session.
Translation between R and Python objects (for example, between R and Pandas data frames, or between R matrices and NumPy arrays).
Flexible binding to different versions of Python including virtual environments and Conda environments.
https://rstudio.github.io/reticulate/
Note
Reticulate embeds a Python session within your R session, enabling seamless, high-performance interoperability. If you are an R developer that uses Python for some of your work or a member of data science team that uses both languages, reticulate can dramatically streamline your workflow!
However, if you are working on a single person data analyst project, consider the complexity, and consider which language you are actually more comfortable in, and lastly, can you solve the problem with a single language easily?
Reticulate is meant for working in the R language, when you need to call in some Python functionality, for example scripts, libraries or modules that do already an important chunk of work, and which you don’t want to re-develop in R.
In order to do so, we need to install the Reticulate R package and configure, where to find our Python interpreter/environment.
install.packages('reticulate')

library(reticulate)
We can use use_python(), use_virtualenv() or use_condaenv() functions to specify versions of Python in virtual or Conda environments, for example like so:
use_condaenv(condaenv = "geopy2020", conda = "auto", required = TRUE)
py_config()
Output is:
python:         C:\dev\conda3\envs\geopy2020\python.exe
libpython:      C:/dev/conda3/envs/geopy2020/python37.dll
pythonhome:     C:\dev\conda3\envs\GEOPY2~2
version:        3.7.8 | packaged by conda-forge | (default, Jul 31 2020, 01:53:57) [MSC v.1916 64 bit (AMD64)]
Architecture:   64bit
numpy:          C:\dev\conda3\envs\GEOPY2~2\lib\site-packages\numpy
numpy_version:  1.19.1

NOTE: Python version was forced by use_python function
From there, you can start importing (loading) Python functions and modules, which you then can apply to your data.
For quick start summary of possibilities have a look at the R cheatsheets web page for the Reticulate cheatsheet.
Note
Try working through the “Sourcing Python Scripts example”.
Then try calling some your own Python scripts through the Reticulate interface. For that, take some of your code from your Python Jupyter notebooks and put them into a “text file” with the file ending .py (creating a Python script).
The following snippet is a short condensed script version of parts of Lecture 5, zonal statistics. We read the catchments polygons, and perform zonal statistics against the DEM tif raster. Save it as script1.py.
from rasterstats import zonal_stats
import pandas as pd
import geopandas as gpd

def get_catchment_dem_stats():
    zs = zonal_stats('../../L5/porijogi_sub_catchments.geojson', '../../L5/dem.tif', stats=['mean','std'])
    catchments = gpd.read_file('../../L5/porijogi_sub_catchments.geojson')
    demstats_df = pd.DataFrame(zs)
    demstats_df.rename(columns={'mean':'dem_mean','std':'dem_std'}, inplace=True)
    catchments = pd.concat([catchments, demstats_df], axis=1)
    return catchments
We are now “sourcing” a Python script script1.py, which has a function get_catchment_dem_stats() that return as GeoDataFrame with zonal raster statistics
source_python("script1.py")

catchments <- get_catchment_dem_stats()
If you are trying this in RStudio, please do NOT click on the variable explorer to look into this variable. It will might crash your current session. The reason becomes clear in the next steps :-)
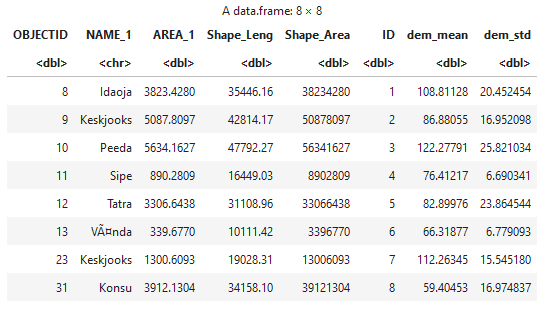
print(catchments)
A warning message might appear:
Warning
Warning message in format.data.frame(if (omit) x[seq_len(n0), , drop = FALSE] else x, : “corrupt data frame: columns will be truncated or padded with NAs”
It will print the dataframe though. But as you can see, the geometry column is not understood.
The Python GeoDataFrame is an extended version of the classic Pandas DataFrame. But only the default Pandas and NumPy technical bits are compatible between R and Python. If you transfer data between R and Python make sure to stick with the base data types (string/characters, integers, double/float, boolean, lists/vectors … for more detailed info check the documentation).
OBJECTID    NAME_1    AREA_1 Shape_Leng Shape_Area ID
1        8    Idaoja 3823.4280   35446.16   38234280  1
2        9 Keskjooks 5087.8097   42814.17   50878097  2
3       10     Peeda 5634.1627   47792.27   56341627  3
4       11      Sipe  890.2809   16449.03    8902809  4
5       12     Tatra 3306.6438   31108.96   33066438  5
6       13    Vända  339.6770   10111.42    3396770  6
7       23 Keskjooks 1300.6093   19028.31   13006093  7
8       31     Konsu 3912.1304   34158.10   39121304  8
                           geometry  dem_mean   dem_std
1 <environment: 0x0000000023c88ec8> 108.81128 20.452454
2                              <NA>  86.88055 16.952098
3                              <NA> 122.27791 25.821034
4                              <NA>  76.41217  6.690341
5                              <NA>  82.89976 23.864544
6                              <NA>  66.31877  6.779093
7                              <NA> 112.26345 15.545180
8                              <NA>  59.40453 16.974837
As you can see, although R understood that it is a DataFrame, it cannot interpret the geometry column.
So we filter this column out, and then we can deal with the dataframe and column further.
library(dplyr)

catchments2 = select(catchments, -geometry)

catchments2
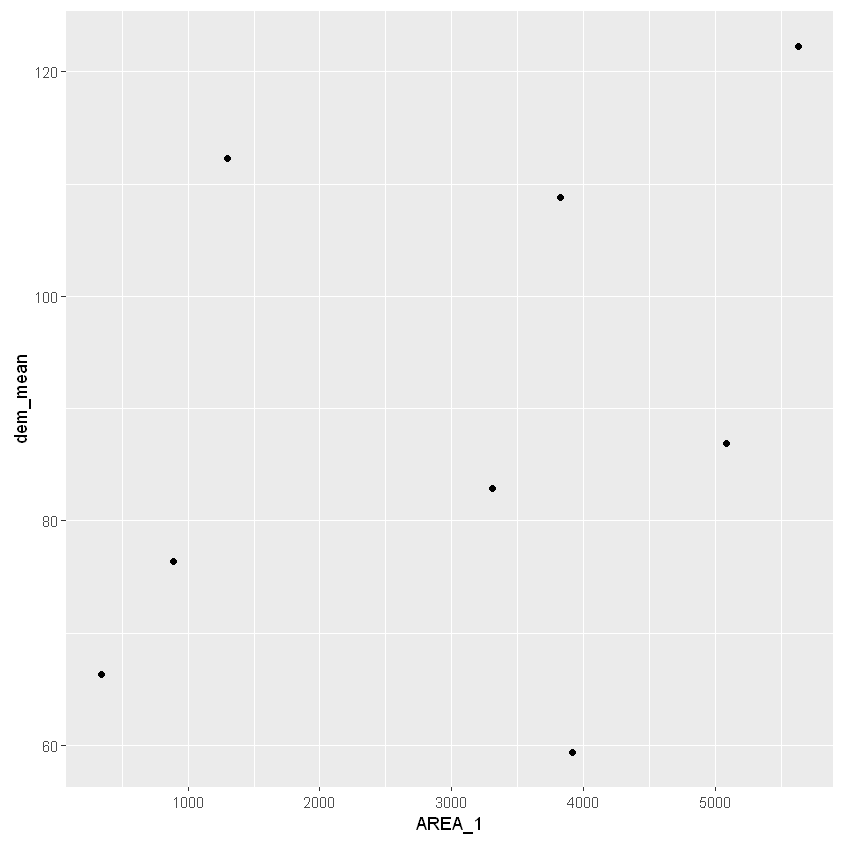
For the sake of the example, we can also plot the values from the dataframe. If you do this in a Jupyter notebook, it will also show the plot.
library(ggplot2)

ggplot(data = catchments2, mapping = aes(x = AREA_1, y = dem_mean)) + geom_point()
Note
TODO: Load the geometries with R and make a proper geospatial plot :-)
Python:rpy2
Documentation for current version
If you install via conda it will try to install R into your conda environment. While this works, it is not great, because you already have a R installed. You can experiment with different R versions on your computer, that is usually not dramatic.
However, as conda might install R 4.0 and you might have R 3.x on your computer, you need to take extra care with setting your R library paths. R 4 and R 3 packages will not be compatible and maxed install can ruin your set-up.
Better with pip, circumventing conda’s full-blown packagement:
(geopy2020) pip install rpy2
If you want to try R managed and updated through conda, try this instead:
(geopy2020) conda install -c conda-forge rpy2
Rpy2 can be sometimes a bit clunky to initialize correctly.
To get started you obviously need to import the module can then interact:
import rpy2
The high-level interface is trying to make the use of R as natural as possible for a Python user
Check the R environment information:
import rpy2.situation
for row in rpy2.situation.iter_info():
    print(row)
Importing the top-level sub-package is also initializing and starting R embedded in the current Python process
import rpy2.robjects as robjects
Importing R packages is often the first step when running R code, and rpy2 is providing a function rpy2.robjects.packages.importr() that makes that step very similar to importing Python packages.
from rpy2.robjects.packages import importr
# import R's "base" package
base = importr('base')

# import R's "utils" package
utils = importr('utils')
Note
Task
Try working through the example.
Then try calling some your own R scripts through the rpy2 interface.